Fish Report for 10-28-2019
Genetic Time Machine: Insights from Century-old Salmon Scales
by FISHBIO
10-28-2019
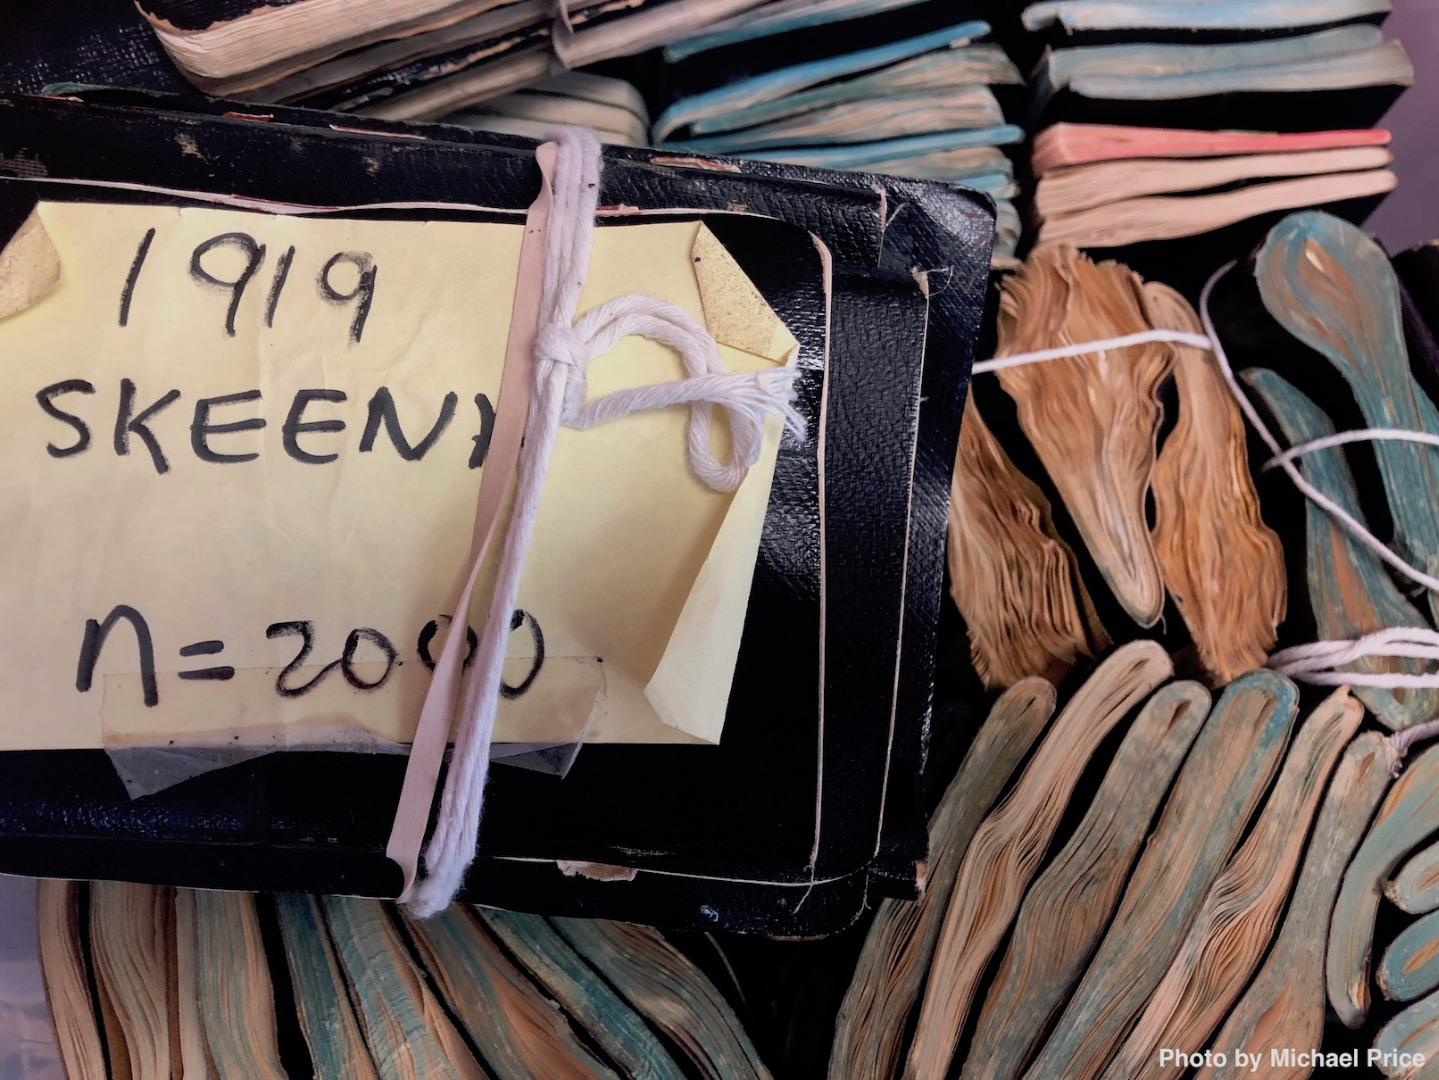
If Antiques Roadshow is any indication, forgotten treasures have a tendency to turn up in unassuming boxes stashed away in damp basements and dusty attics. In most cases, these rediscovered riches aren’t coated in century-old fish slime – but even those that are can prove priceless. The Skeena River is the second largest salmon watershed in Canada, and sockeye (Oncorhynchus nerka) populations that spawn there have been a valuable resource for indigenous peoples for many centuries. Skeena sockeye first became the target of a commercial fishery in 1877, which expanded to a 15-cannery, million-fish-a-year operation by 1920. Even for well-studied species like salmon, researchers rarely have historical information to extend their understanding more than a few decades into the past. Skeena sockeye population data are available from the 1960s onward, but the first 80 years of the fishery represent an unknown black box. However, genetic analysis of a historic collection of fish scales has allowed scientists to begin to fill in this gap, which has brought new understanding of sockeye abundance in the system and the alarming legacy of this valuable fishery (Price et al 2019).
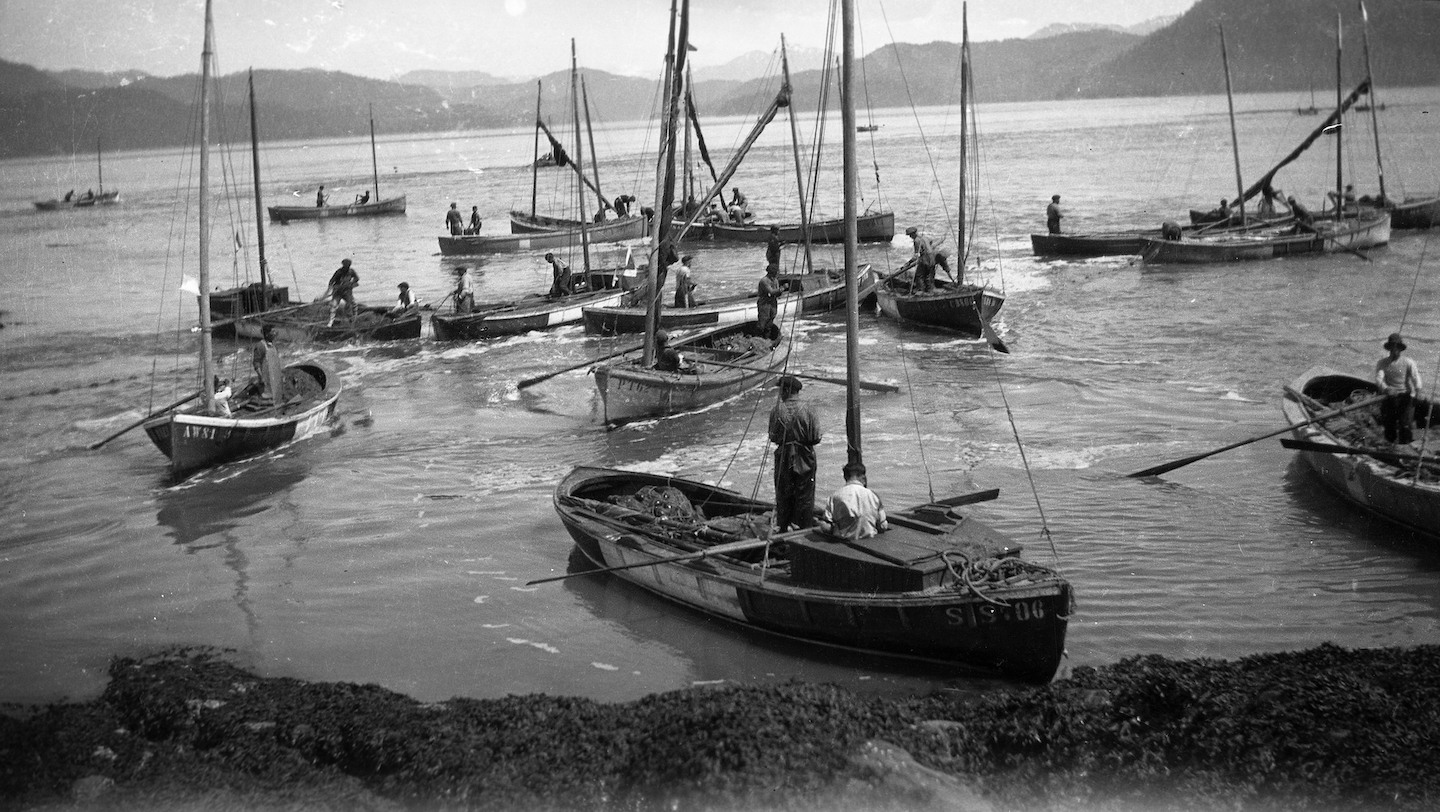
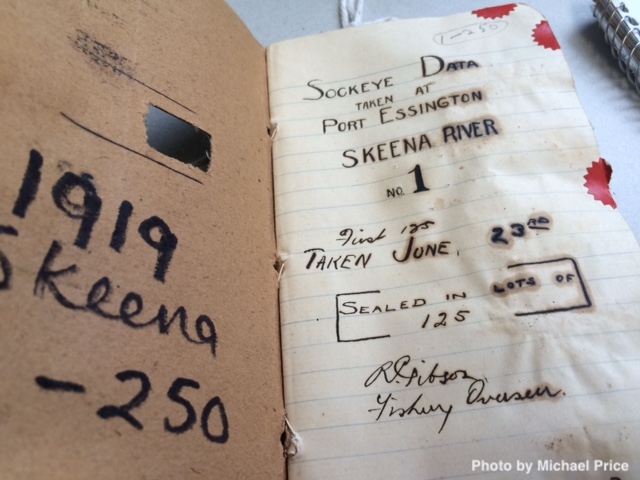
In 1912, pioneering ichthyologist Charles Gilbert turned his famously thorough attention to the Pacific salmon of British Columbia. The first to use scales to determine the age of Oncorhynchus species, Gilbert began meticulously gathering samples and data from sockeye captured in the then young commercial fishery on the Skeena River. At that time, salmon were caught by linen gill nets deployed from small oar- and sail-powered vessels. Gilbert and his crew would measure, weigh, sex, and collect scales from 250 fish per week during the fishing season, which ran from the end of June until mid-August. Because this was a mixed-stock fishery, Gilbert’s sampling included individuals from a variety of populations in the region. For about fifty years, the hundreds of field notebooks containing scales and data painstakingly recorded in elegant longhand were lost to science.
FISHBIO is a dedicated group of research scientists, engineers, and technicians that specialize in counting, tracking, and analyzing trends in fish and wildlife populations throughout the world. An expert staff, technical capacity, and state-of-the-art equipment make FISHBIO a trailblazer in aquatic research. For more information, please visit FISHBIO.com
Photos
More Reports
Wrapping Up a Welcome Water Year
10-21-2019
When plumes of dust rise over almond and walnut orchards from the harvest and truckloads of fresh chopped corn make...... Read More
Mussel Power: Identifying “Hotspots” to Guide Conservation
10-14-2019
Like doctors in an understaffed emergency room, scientists and managers working to conserve biodiversity have often had to strategically apply...... Read More

Website Hosting and Design provided by TECK.net
